Lava, actually: Oxford planetary physicist debuts predicted magma exoplanet
March 10, 2026
Oxford researchers use AI to combat climate misinformation
February 15, 2026
Doomsday Clock moves to 85 seconds to midnight symbolizing humanity’s closest proximity to disaster
January 30, 2026
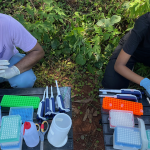
Northwestern University synthetic biology researchers give farmers new tools for more sustainable agriculture
December 30, 2025
Contact Information
Abigail Foerstner, Managing Editor and Medill Associate Professor